

定义:
Grouping objects into sub-groups (clusters) # 等于对数据进行归纳,比如100万数据分成若干组,看不同自己的情况
such that:
- similar objects form a cluster
- dissimilar objects belong to different clusterts
- typically: a similarity-functoin distance is used to measure similarity between objects.
focus further analysis (数据预处理): reduce a large data set by selecting only special clusters.
input for other data mining algorithms: characterize the propertises of the clusters and their relations
Application(目前应用十分广泛):
- customer segmentation (市场营销客户分组)
- document or image collections (图像或文档按相似度分组)
- web access patterns
- hierarchical clustering algorithms (分级聚类) – find successive clusters using previously established clusters
- partitioning clustering algorithms (普通聚类)- determine all clusters at once
- density-based clstering algorithms (基于密度的聚类)- determine clusters based on density (相同的数据属于同一个聚类,那么应该属于同一个密度比较大区域)
分级聚类的方法:
Aim to detect hierarchical relationships fo clusters by iteratively 不仅找到类,还要找到聚类的从属关系。
- 合并的:merging clusters (agglomerative) 聚类,假设10万个,合并5万个,再合并为1000个,可以用树来表示,根节点表示最大的聚类。
- 分裂的:splitting clusters (divisive),所有的数据都属于一个类,树根,按相似度分为几个小的类,每个叶节点都只有一个数据。

A similarity measure of clusters is needed.
minimum distance between elements of each cluster (also called single linkage clustering):
maximum distance between elements of each cluster (also called copmplete linkage clustering ) :
mean distance between elements of each cluster (also called average linkage clustering):
Running time
Difficult to determine the cut of dendrogram
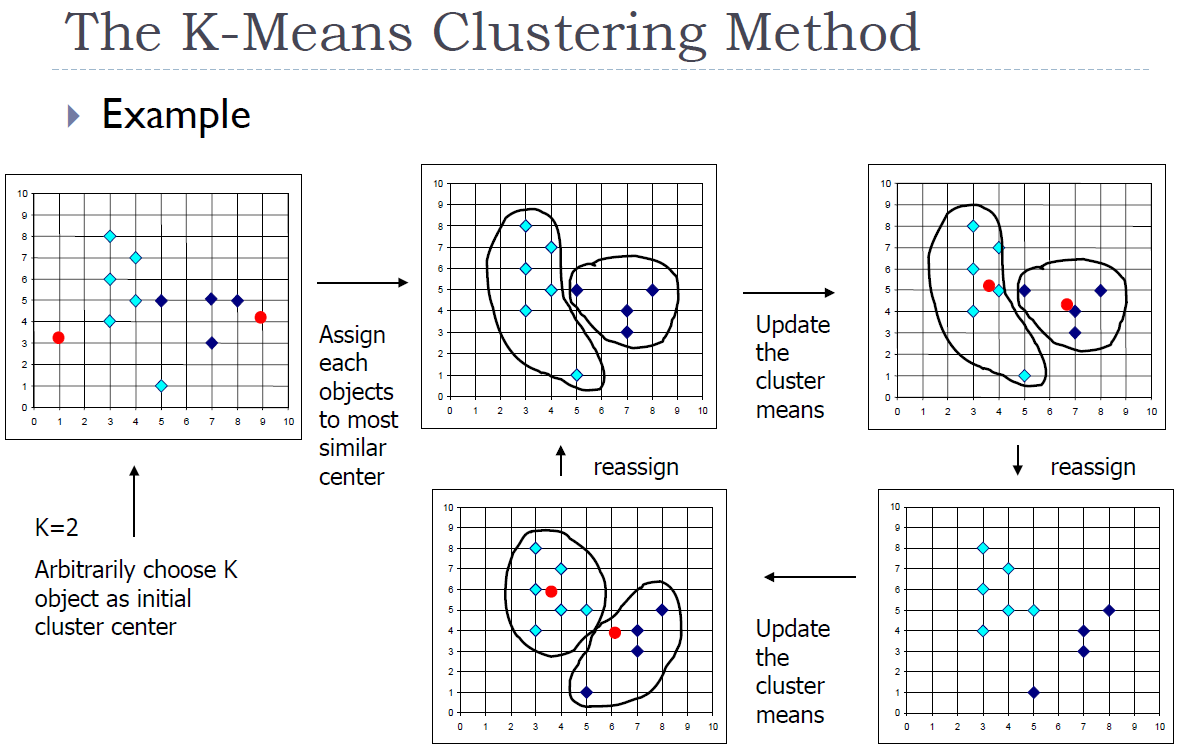
-means Clustering Method
Given , the k-means algorithm is implemented in four steps:
- Partition objects into nonempty subsets; (初始化,随机分类)
- Compute seed points as the centroids of the clusters fo the current partition (the coentrolid is the center i.e., mean point of the cluster); (算质心:坐标求和取平均)
- Assign each objects to the cluster with the nearest seed point ; (每个类到质心的距离)
- Go back to step 2, stop when no more new assignment; (整个过程反复迭代)
每次循环做 次比较,算质心:坐标的和求平均。,到底循环多少次,根据数据的分布有关系,不能直接算
可视化演示:https://www.naftaliharris.com/blog/visualizing-k-means-clustering/

课堂提问:
几个参数?
1. 质心在变 (固定参数,1先固定质心,解优化过程中,怎样分配,让目标函数降低,每个点到质心的距离总和是目标函数,每个距离都极小化,一个k个质心,让每个数据都找到一个最近的质心。)
2. 从属关系在变 (同时解这两个参数很难,所以固定一个,再解一个,叫EM方法,第一步估计(Expection),第二步是目标最大化 maximization,得到最优解之后更新另个)
基于密度的聚类方法:
Clusterr are sense regions in the data space, separated by regions of lower objects density.
Adcantages:
- Clusters can have arbitrary shape and size (k-means 只能找到规则形状的类,基于密度的聚类可以不受限于形状,大小可调)
- Number of clusters is determined automatically (不需要k超参数?啥叫超参数)
- Can separate clusters from surrounding noise (区分噪声点和非噪声点)
- Can be implemented efficiently (很高效)
- Can be integrated into databases (对数据库支持很好)
r core object w.r.t.
MinPts 表示参数,例如=5,如果一个区域内点的个数大于 5, 就叫做直接可达。
p directly density-reachable from q w.r.t. e MinPts, if
and
is a core object w.r.t. , MinPts.
density-reachable: = transitice closure
Cluster:
maximal w.r.t. density reachability
any two points are density – connected
i.e., density-reachable from a third object
noise : any object not contained in a cluster
DBSCAN Algorithm
e (半径), MinPts(圈圈包含多少个点才行)
任意选一个数据,以它为中心,画圈圈,以e为半径,在高维空间就是个超球。但是这个圈圈里只有一个1个,小于 MinPts, 所以不是核心点。
随便找下一个点,同样画一个圈圈,数点,发现这次有3个点,直接可达的。类的定义:必须是极大化的,所有其他点,能不能以两个绿颜色的点为中心,画圈圈,数点,重复刚才的工作,继续扩大。 没有新的点加入,找另个,这回有两个新的绿颜色点,这回两个绿颜色和三个红颜色的点是属于同一个类的。这次再看能不能抓一些新的数据进来。如果一直有新的,就一个画,没有了就停了。
算法复杂度:
画圈,看圈里有多少数据,n 个向量,n 个圈圈,复杂度为 O(n)。
O(n * runtime (e –neighborhood query))
regionquery * algorithm
Without inde
With index ,
CLARANS on SEQUOIA 2000 data

DBSCAN的演示:https://www.naftaliharris.com/blog/visualizing-dbscan-clustering/

估计参数的方法请参考原文
- Ester M, Kriegel H P, Sander J, et al. A Density-Based Algorithm for Discovering Clusters in Large Spatial Databases with Noise[C]// International Conference on Knowledge Discovery & Data Mining. 1996.

DBSCAN算法下载:http://www.cs.ecu.edu/dingq/CSCI6905/readings/DBSCAN.pdf
DBSCAN算法也有不足:

而此时k-means算法效果反而更好?
** libsvm.zip已上传至资料,传送门:https://www.neusncp.com/user/file?id=156
另附斯坦福大学数据挖掘课程的PPT一份:12-clustering.pdf
————————
* 徐晓伟,美国阿肯色大学小石城分校信息科学系教授,兼任数学系教授;曾任美国联邦食品和药物管理局国家毒理学实验室(National教授。1983年在南开大学数学系获得学士学位,1987年在中国科学院沈阳计算技术研究所获得硕士学位,1998年在德国慕尼黑大学(University of Munich)获得博士学位。1998年~2002年在西门子公司任高级研究科学家; 自2012年任中国科学院沈阳自动化研究所客座研究员,博士生导师; 同时兼任东北大学客座教授。曾经是香港中文大学访问教授;为多家国际公司提供咨询服务,其中包括西门子公司,Axciom 公司,Dataminr 公司 和东软公司。多次在模式识别和数据挖掘领域知名国际会议上作大会特邀报告,在国际知名学术期刊和国际会议上发表了具有原创性的研究成果。他提出的基于密度的聚类等一系列理论算法,具有理论原创性,并被写入教科书。
** NEUSNCP平台注册免邀请码注册链接: Click