

最近在看Physics Reports上的一篇多层网络综述,里面有很多好看的配图,发现这些大牛用R语言写了一个可视化工具,所以从github上下载下来调试了一下。这是原始安装说明:

INSTALLATION
Download and install a copy of Octave (3.4.0 or above):
http://www.gnu.org/software/octave/download.html
Octave should be accessible through command line from any folder (i.e., it is mandatory to add it in your PATH environment variable).
If you are not familiar with this simple task, you should visit
http://www.java.com/en/download/help/path.xml
muxViz requires R v3.0.2 (or above). Download and install a copy of R from
http://www.r-project.org/
Some external packages are required within the R environment. However, the main script should be able to detect the missing packages and install them, automatically. Therefore, it is likely that you do not need to install them by yourself.
You can download muxViz from Github: https://github.com/manlius/muxViz/archive/master.zip
To work properly with geographical networks, the GDAL (Geospatial Data Abstraction Library) is required and should be installed before running muxViz for the first time. GDAL should be available as an R package and should be easily installed just by typinginstall.packages("sp") install.packages("rgdal")within the R environment. However, in a few cases it can be more complicated and some users reported problems for its installation. If this is also your case you might want to take a look at some suggestions on stackoverflow (Read on stackoverflow) or on this blog (Read on spatial.ly). In any case, it is highly recommend to visit the GDAL website and follow the hints provided there (go to GDAL official website).
导入Github上的源码:MuxViz-master.zip,感谢一下作者:
- Manlio De Domenico, Mason A. Porter, Alex Arenas, Multilayer Analysis and Visualization of Networks, published in Journal of Complex Networks 3, 159-176 (2015) (Open Access)
解压,然后在Rstudio中切换工作路径,变成刚刚解压的工作路径,然后点击文件-运行脚本文件,选择MuxVizGUI.R,程序会自动检测缺少的包并且安装。遇到了一些问题:
说明:安装环境:R语言 3.5 (最近更新4.0之后安装失败了![]() ),Octave 4.4(这个不安装似乎也OK,暂时没发现bug),安装完配置环境变量,让Octave能够在任意路径直接访问。
),Octave 4.4(这个不安装似乎也OK,暂时没发现bug),安装完配置环境变量,让Octave能够在任意路径直接访问。
建议:不要默认装 C 盘!!!
可能遇到的问题:
1. 无法在windows环境上安装rgdal
Error in library(rgdal) : there is no package called ‘rgdal’
2. 没有shinyDash包
Error in library(ShinyDash) : 不存在叫‘ShinyDash’这个名字的程辑包
第一个问题是因为windows上的稳定版包是rgdal1.3_2,而不是默认的1.3_3,解决办法:去https://cran.r-project.org/web/packages/rgdal/index.html下载1.3.2版本,下载地址:https://cran.r-project.org/bin/windows/contrib/3.5/rgdal_1.3-2.zip
然后在Rstudio里选择从本地安装。
第二个问题无法找到shinyDash包,Google搜索shinyDash能找到https://github.com/trestletech/ShinyDash,原来是Github上的包,这个需要先安装devtools
install.packages("devtools")
下载之后解压,在R语言的UI窗口中选择切换工作空间,选择刚刚解压的ShinyDash-master,然后在执行:
install.packages("ShinyDash")
devtools::install_github("ShinyDash", "trestletech") #这句好像不好用。
install_github('trestletech/ShinyDash') # 新版本的语句应该是这样的
如果还没成功,请看终极解决方案:
ShinyDash.zip 请下载已经安装好的压缩包,解压后放在R路径下的libraray目录下。
这样就安装好了。

安装rCharts出错。出错:Error in setwd 或者出错:tar 解压错误,请自行翻墙重新执行命令:
require(devtools)
install_github('ramnathv/rCharts')
运行后的结果是这个样子的:

用自带的数据集20个节点,675条边,32层通用多层网络,绘制的图像如下。

人家还可以拖动,不同角度。。。

这是对32层网络每一层的统计分析结果,这个是components

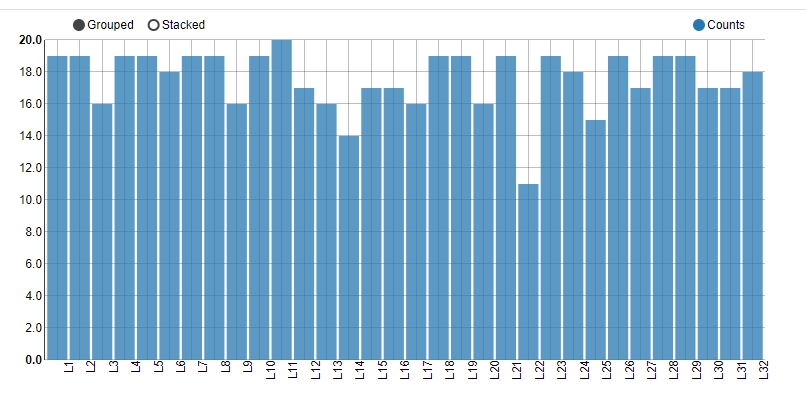
这个是边的个数
再来一个六层的网络:

Muxviz是基于R语言的多层网络可视化分析工具,支持multiplex网络和一般意义上的multilayer networks,并且支持切换视角,绘制出来的图还是很不错的。但是,由于数据格式要求非常严格,经常容易出错,一定要针对示例网络仔细核对,欢迎大家留言一起交流学习
参考资料:
- Manlio De Domenico, Mason A. Porter, Alex Arenas, Multilayer Analysis and Visualization of Networks, published in Journal of Complex Networks 3, 159-176 (2015) (Open Access)